
Spring practices are gearing up across the country and that’s a great way to gauge the interest level of each of the 13 FBS fan bases in Texas.
Attendance trends are an even better way to understand the feelings of supporters over a given time span. With data from D1ticker.com, we've compiled numbers including stadium capacity, year-over-year change percentages, and five-year averages and chances.
1. TEXAS LONGHORNS
2023 Stadium capacity percentage: 101.5 percent
2023 attendance avg: 101,625
2022 attendance avg: 100,242
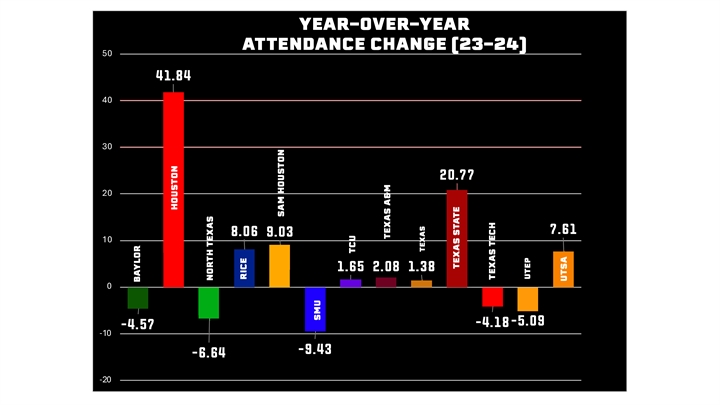
Year-over-Year change: +1.38 percent
5-year attendance avg: 95,796
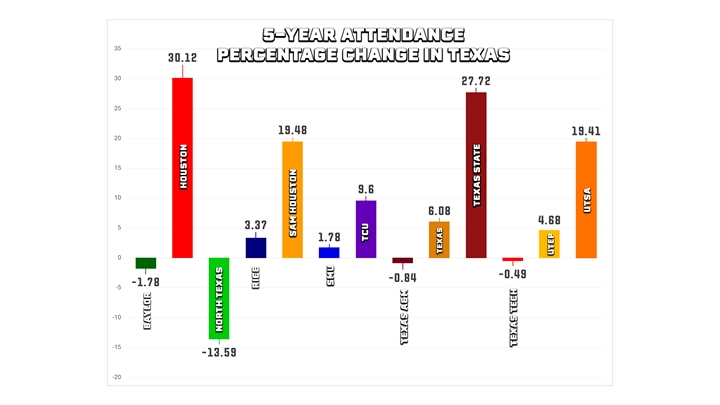
5-year percentage change: +6.08 percent
Winning is good for business. The yearly average improving is especially impressive considering that Alabama played at DKR in 2022. This number should only increase with a home game against Georgia and other SEC opponents in 2024.
2. TEXAS A&M AGGIES
2023 Stadium capacity percentage: 96.59 percent
2023 attendance avg: 99,234
2022 attendance avg: 97,213
Year-over-Year change: +2.08
5-year attendance avg: 100,070
5-year percentage change: -0.84 percent
Surprisingly, attendance for Texas A&M improved in 2023 compared to 2022 despite on-field issues and off-field drama that led to Jimbo Fisher’s termination despite a massive buy-out. A solid home schedule that included Alabama, and the loyalty and passion of the 12th Man deserves credit.
3. TEXAS TECH RED RAIDERS
2023 Stadium capacity percentage: 96.96
2023 attendance avg: 54,491
2022 attendance avg: 56,870
Year-over-Year change: -4.18 percent
5-year attendance avg: 54,758
5-year percentage change: -0.49 percent
Home games against Texas and Oklahoma, as well as the first-year coaching bump in excitement, ballooned Red Raider attendance in 2022. Texas Tech took a step back in 2023, but not by much. The attendance in 2023 was essentially aligned with the five-year average. But it does beg the question: What is the new attendance norm for the in-state Big 12 schools now that OU and Texas won’t visit every two years?
4. TCU HORNED FROGS
2023 Stadium capacity percentage: 102.89
2023 attendance avg: 47,311
2022 attendance avg: 46,562
Year-over-Year change: +1.65 percent
5-year attendance avg: 43,184
5-year percentage change: +9.6 percent
Attendance was expectingly up for the Horned Frogs the year after reaching the national championship game. The home schedule included Deion Sanders’ debut as Colorado head coach and the last scheduled visit to Fort Worth by the Longhorns. Even with the on-field struggles, TCU added nearly 10 percent more spectators in 2023 than the five-year average.
5. BAYLOR BEARS
2023 Stadium capacity percentage: 96.12
2023 attendance avg: 43,388
2022 attendance avg: 45,463
Year-over-Year change: -4.57 percent
5-year attendance avg: 44,175
5-year percentage change: -1.78 percent
Baylor was one of five programs in Texas with lower attendance in 2023 than in 2022. That is expected during a three-win season. A sellout against Texas helped the cause.
6. HOUSTON COUGARS
2023 Stadium capacity percentage: 90.05 percent
2023 attendance avg: 36,020
2022 attendance avg: 25,395
Year-over-Year change: +41.84 percent
5-year attendance avg: 27,681
5-year percentage change: +30.12
The proof that Houston’s move to the Big 12 was correct despite the first-year struggles and firing of Dana Holgorsen is found in the attendance numbers. Replacing conference games against Temple and Tulsa with TCU and Texas led to the biggest jump in attendance from 2022 to 2023 in Texas.
7. UTSA ROADRUNNERS
2023 Stadium capacity percentage: 82.54 percent
2023 attendance avg: 28,876
2022 attendance avg: 26,835
Year-over-Year change: +7.61 percent
5-year attendance avg: 24,183
5-year percentage change: +19.41
Jeff Traylor has produced a consistent winner in his four seasons as head coach of the Roadrunners and the city of San Antonio has taken notice. Attendance is up and the good vibes continue in the 210.
8. SMU MUSTANGS
2023 Stadium capacity percentage: 70.68 percent
2023 attendance avg: 22,616
2022 attendance avg: 24,971
Year-over-Year change: -9.43 percent
5-year attendance avg: 22,220
5-year percentage change: +1.78 percent
The Ponies hope that a move to the ACC in 2024 provides an attendance boost like the one experienced by Houston. The 2024 schedule includes home contests against TCU and Florida State in a renovated Ford Stadium. The 2023 schedule was a tough one for fans to get energized for, understandably.
9. TEXAS STATE BOBCATS
2023 Stadium capacity percentage: 70.61 percent
2023 attendance avg: 21,184
2022 attendance avg: 17,541
Year-over-Year change: +20.77 percent
5-year attendance avg: 16,586
5-year percentage change: +27.72
Something this exercise solidified: Winning begets attendance. Texas State is further proof. Attendance increased by over 20 percent in the eight-win season capped off with the school’s first FBS bowl bid – and win. A strong home schedule in 2024, including a game against UTSA in San Marcos, might help Texas State average 25,000.
10. RICE OWLS
2023 Stadium capacity percentage: 43.71 percent
2023 attendance avg: 20,542
2022 attendance avg: 19,011
Year-over-Year change: +8.06 percent
5-year attendance avg: 19,872
5-year percentage change: +3.37 percent
Rice Stadium is so large that the 20,000 average attendees for Rice games looks more like 10K. The Owls are the third-most attended G5 program in Texas behind UTSA and Texas State.
11. UTEP MINERS
2023 Stadium capacity percentage: 38.91 percent
2023 attendance avg: 18,160
2022 attendance avg: 19,134
Year-over-Year change: -5.09 percent
5-year attendance avg: 17,348
5-year percentage change: +4.68 percent
Two consecutive losing seasons caused attendance to drop and Dana Dimel to be fired. Still, the 18,160 average in 2023 was nearly five percent more UTEP's five-year average. Multiple midweek games due Conference USA's schedule didn't help.
12. NORTH TEXAS MEAN GREEN
2023 Stadium capacity percentage: 57.57 percent
2023 attendance avg: 17,761
2022 attendance avg: 19,025
Year-over-Year change: -6.64 percent
5-year attendance avg: 20,544
5-year percentage change: -13.59 percent
A home opener against SMU in 2022 helped boost North Texas attendance in 2022, but it was shocking to learn that the Mean Green had the second-most year-over-year drop in Texas. Only four teams – North Texas, Baylor, Texas Tech, and Texas A&M – had 2023 attendances lower than the five-year average. North Texas’ percentage drop was the only one of the four Texas programs that experienced lowered attendance to be greater than two percent. This despite a coaching change, an exciting offense, and home games against Cal, Memphis, and UTSA.
13. SAM HOUSTON BEARKATS
2023 Stadium capacity percentage: 59.27 percent
2023 attendance avg: 8,298
2022 attendance avg: 7,611
Year over Year change: +9.03 percent
5-year attendance avg: 6,945
5-year percentage change: +19.48 percent
The jump to FBS boosted attendance by nearly 20 percent compared to the five-year average. Those 2023 numbers would be even higher if the Bearkats didn't play so many midweek conference games.
This article is available to our Digital Subscribers.
Click "Subscribe Now" to see a list of subscription offers.
Already a Subscriber? Sign In to access this content.